

When Collectors faced problems with their legacy systems, they turned to Lightdash to transform their data landscape.
80%
less BI tool spend
500+
Lightdash users vs 80 Tableau licenses
70%
faster development times
36%
less dashboard duplication
When your company grades tens of thousands of sports cards and memorabilia items daily, you generate a lot of data. But when that company has been around for 30 years, that data tends to pile up in creative and chaotic ways.
That's exactly what Rohan Thakur, Director of Analytics at Collectors, walked into when he joined the team.
The problem: decades of data chaos
Collectors' data landscape was a patchwork quilt of legacy systems built over decades. This included hundreds of stored procedures in SQL Server Reporting Services (SSRS) from over 10 years ago, and multiple Tableau instances with custom calculations scattered everywhere and each system defining the same metric differently.
"In Tableau, you could have an extract that somebody set up manually in some way and then defined a metric off of that. But in SSRS, someone has written a sproc [stored procedure] in a different way and is visualizing a similar sounding metric."
- Rohan Thakur, Director of Analytics
Revenue meant one thing in SSRS, something slightly different in Tableau, and nobody knew which was right. This gave birth to multiple problems:
Metrics lived in silos. Each dashboard creator defined "Active Users" however they wanted. There was no standardization or version control.
Business users couldn't explore. They wanted to dig deeper but found the tools too complicated. Simple questions meant waiting for the resource-constrained data team.
No documentation. All that careful documentation in dbt was invisible to dashboard users unless manually recreated.
Debugging was nearly impossible. Tracing discrepancies from Tableau back to SQL took forever.
Development felt fragmented. Build in dbt, then rebuild in Tableau. There was no shared version control and results changed over time with no easy way to reconcile.
The breaking point came when stakeholders started exporting different versions of the "same" data to Excel, creating even more confusion.
How Lightdash won them over in 15 minutes
When Collectors started evaluating new BI tools in 2023, Lightdash wasn't even on their initial list. As a seed-stage startup, Lightdash barely registered against established players like Looker, PowerBI, and Sigma.
But established vendors came with established sales processes.
"We often found ourselves on initial discovery calls with a business development representative where we had to restate the same issue. This would be followed by another sales call with multiple representatives where we were asked numerous questions about our organization's roadmap for 2023, before we were finally able to see a short demo."
- Rohan Thakur, Director of Analytics
Lightdash took a different approach.
"Within 15 minutes of discussion we were told that the best way to proceed would be to take the tool for a spin with a free 45 day trial."
- Rohan Thakur, Director of Analytics
That trial changed everything. What immediately stood out to Collectors was how Lightdash read directly from their dbt project. The Lightdash semantic layer made their existing dbt investment finally pay off at the visualization layer.
"Because Lightdash reads directly from your dbt project, the development process is seamless, allowing us to iterate rapidly."
- Rohan Thakur, Director of Analytics
The workflow transformation was dramatic:
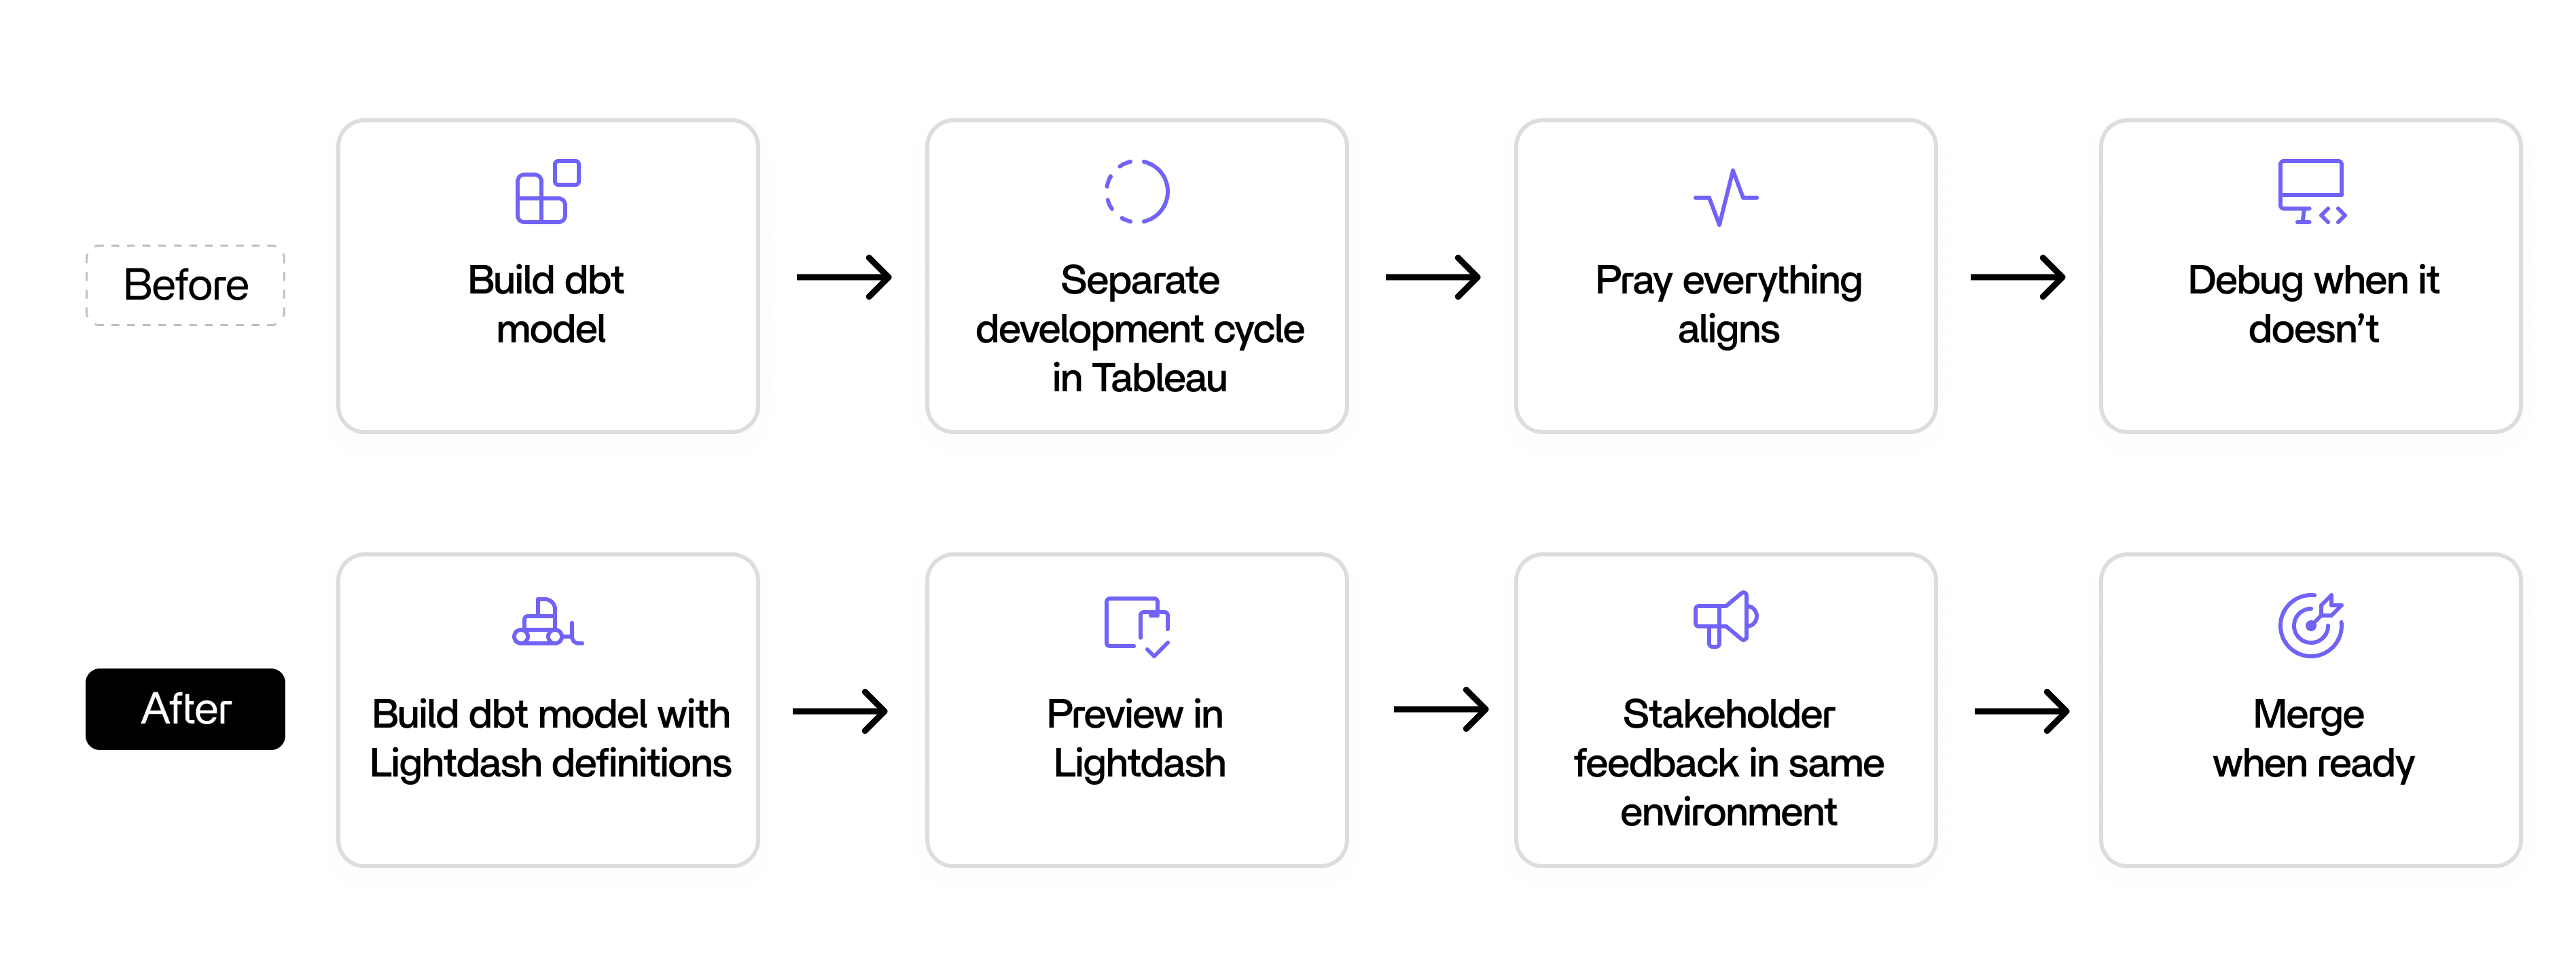
"We could define metrics in dbt that natively integrated with Lightdash. This means that Active Users was defined exactly once and meant the same thing everywhere it was used.”
- Rohan Thakur, Director of Analytics
With Lightdash, there were no more inconsistencies - just one source of truth.
The real game changer: Lightdash preview environments
For Collectors, the real magic happened with preview environments. Lightdash could spin up preview dashboards directly from development branches, integrated into their CI checks.
"We built these previews into our continuous integration checks so that upon each pull request, developers could have a playground for data validation with their latest changes."
- Rohan Thakur, Director of Analytics
This changed how they worked with stakeholders.
"Our developers will create the dbt model, and then they'll throw together a couple of charts, or a prototype dashboard, and say, does this kind of resemble what you were asking for? And then they'll give access to that preview environment to a couple of stakeholders, and for approval. And that pull request is still open, you're still making changes to it."
- Rohan Thakur, Director of Analytics
The stakeholder feedback loop collapsed from weeks to hours. Now, business users could see exactly what they were getting before it hit production.
Tackling the SSRS migration
Migrating from Tableau was straightforward and took only a few months, but SSRS was a different beast entirely. Collectors had over 1,000 SSRS reports spanning more than a decade and the complexity of the migration lay in the technical debt accumulated over years.
Collectors followed a structured approach:
Step 1: Ruthless prioritization. They analyzed usage statistics and deprecated hundreds of unused reports. Why migrate what nobody uses?
Step 2: Transform the foundation. Those stored procedures became well-tested, reusable dbt models organized by business context.
Step 3: Leverage the semantic layer. Centralized metric creation through Lightdash Metrics ensured a consistent source of truth across all reports.
Step 4: Validate religiously. They cross-referenced key metrics against legacy systems, spot-checked numbers with stakeholders, and even built custom dbt tests to compare exported summaries between old and new systems.
Step 5: Manage the transition. They added deprecation banners to old reports, along with links to new versions, and contact info for questions.
The whole SSRS migration took over a year, but was successful.
The results
The numbers speak for themselves:
36% reduction in dashboards through better consolidation
50% faster report load times
70% faster development time
500+ Lightdash users (vs 80 Tableau licenses before)
80% reduction in BI tool costs
But the numbers only tell part of the story.
Self-service became real and data was transparent by default. Users could now see the SQL behind any chart, which empowered them to understand the data source and associated dbt model, promoting a more interactive and dynamic data exploration process.
The team also went from dreading BI work to embracing it. Seamless workflows, preview environments, and confident deployments changed everything.
With their foundation solid, Collectors is now exploring Lightdash's AI features to push their analytics even further. The team that once spent months migrating away from legacy chaos is now at the forefront of what's possible with AI-powered business intelligence.
Ready to solve your own metrics chaos?
Let's talk about how Lightdash can help your team move faster, cleaner, and smarter. Just book a demo with a member of our team to get started with your free trial.
Ready to free up your data team?
Try out our all in one open, developer-loved platform.


Collectors provides a comprehensive platform for finding, buying, authenticating, tracking, and researching items across sports cards, coins, video games, and Pokémon cards. The company operates industry-leading authentication and grading services including PSA (trading cards), PCGS (coins), and WATA (video games), alongside CardLadder for sports card analytics and financial tracking. Through digital innovation and its family of trusted brands, Collectors is modernizing the collectibles industry for enthusiasts and investors alike.
Industry
Consumer Services
Location
California, USA
Employees
1000-5000


