Getting data in front of decision-makers shouldn’t require copying screenshots into slide decks. Yet for many data teams, that manual work is still the last mile of analytics.
Lightdash was built to fix the hard part of analytics: defining trusted metrics once, governing them properly, and enabling true self-serve exploration across the business. But as teams scale, one challenge remains: dashboards alone aren’t enough for executive communication.
Today, we’re extending Lightdash beyond dashboards and into the boardroom with our new integration with Rollstack.
Together, Lightdash and Rollstack turn governed analytics into a complete, end-to-end reporting workflow without breaking your analytics foundation or re-introducing manual work.
How it works: Lightdash at the core
Lightdash is the analytics foundation: where metrics are defined once in dbt, governed by data teams, and safely self-served across the organization. Rollstack extends that foundation into executive workflows by pushing Lightdash charts directly into presentations.
When your data changes, your slides update automatically. This complete solution connects your data warehouse all the way through to your final presentation:
Connect Lightdash to your warehouse. Pull in the data you need from BigQuery, Snowflake, Redshift, or wherever you store it.
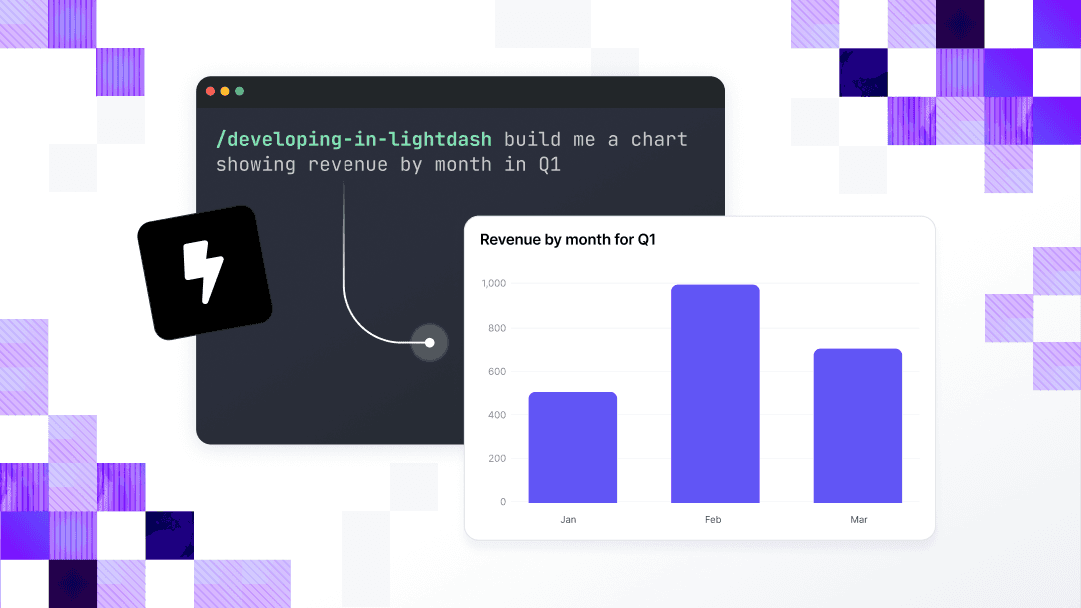
Build your charts. Lightdash's AI agent lets anyone on your team ask questions in plain English and get charts back instantly - no SQL required.
Export directly to your decks. Export charts straight into Google Slides, PowerPoint, or written updates. When your data changes, refresh everything with a single click.
Both Lightdash and Rollstack are SOC2 Type 2 compliant and built with enterprise-grade security in mind.
How Octopus Energy scales analytics without breaking trust
Octopus Energy, a renewable energy company serving millions of customers globally, is scaling analytics across hundreds of users today.
Their data platform team chose Lightdash because governance isn’t optional at their scale. By anchoring analytics to dbt, they maintain strict control over metric definitions while enabling self-serve exploration across the business.
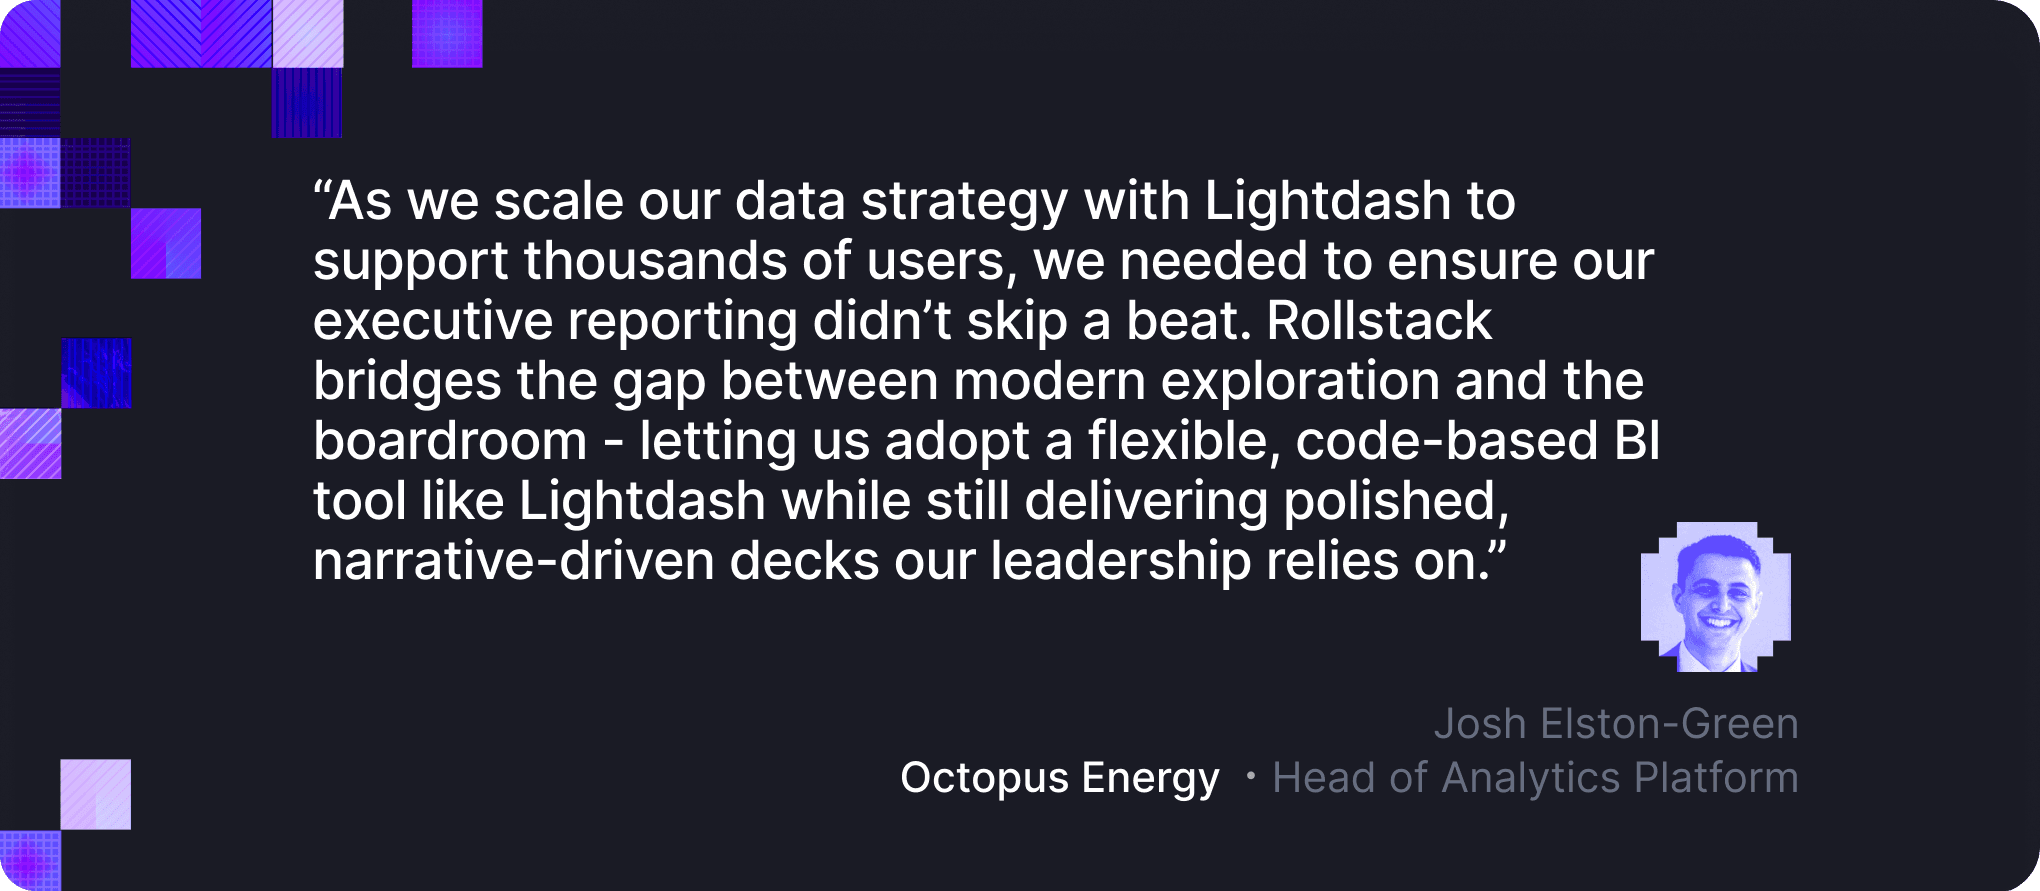
But their Credit Risk team faced a familiar challenge: high-stakes reporting for senior leadership. A dashboard link wasn't going to cut it; they needed polished, narrative slide decks without sacrificing trust in the numbers.
By using Lightdash as their analytics foundation and Rollstack for distribution, Octopus now delivers executive reporting directly from governed metrics into Google Slides. Analysts focus on commentary, risk assessments, and context while the underlying numbers stay connected to the source of truth.
The result: scalable self-serve analytics and reliable executive reporting powered by the same governed metrics in Lightdash.
See Lightdash’s reporting workflow in action
If you're evaluating BI tools, or struggling to scale analytics beyond dashboards, we'd love to show you how this works.
We'll walk you through how teams use Lightdash as their analytics foundation without compromising on governance and trust, and how Rollstack extends that foundation into executive-ready reporting.
Ready to free up your data team?
Try out our all in one open, developer-loved platform.