


Every metric your team agreed on,
in one place
Search the catalog, click any metric, and see it charted over time with its owner, its definition and last year's comparison already in place.


Trusted by data teams who define their metrics once, in code

Catalog
Explorer
Curate
Trees
Everyone knows which number is the real one
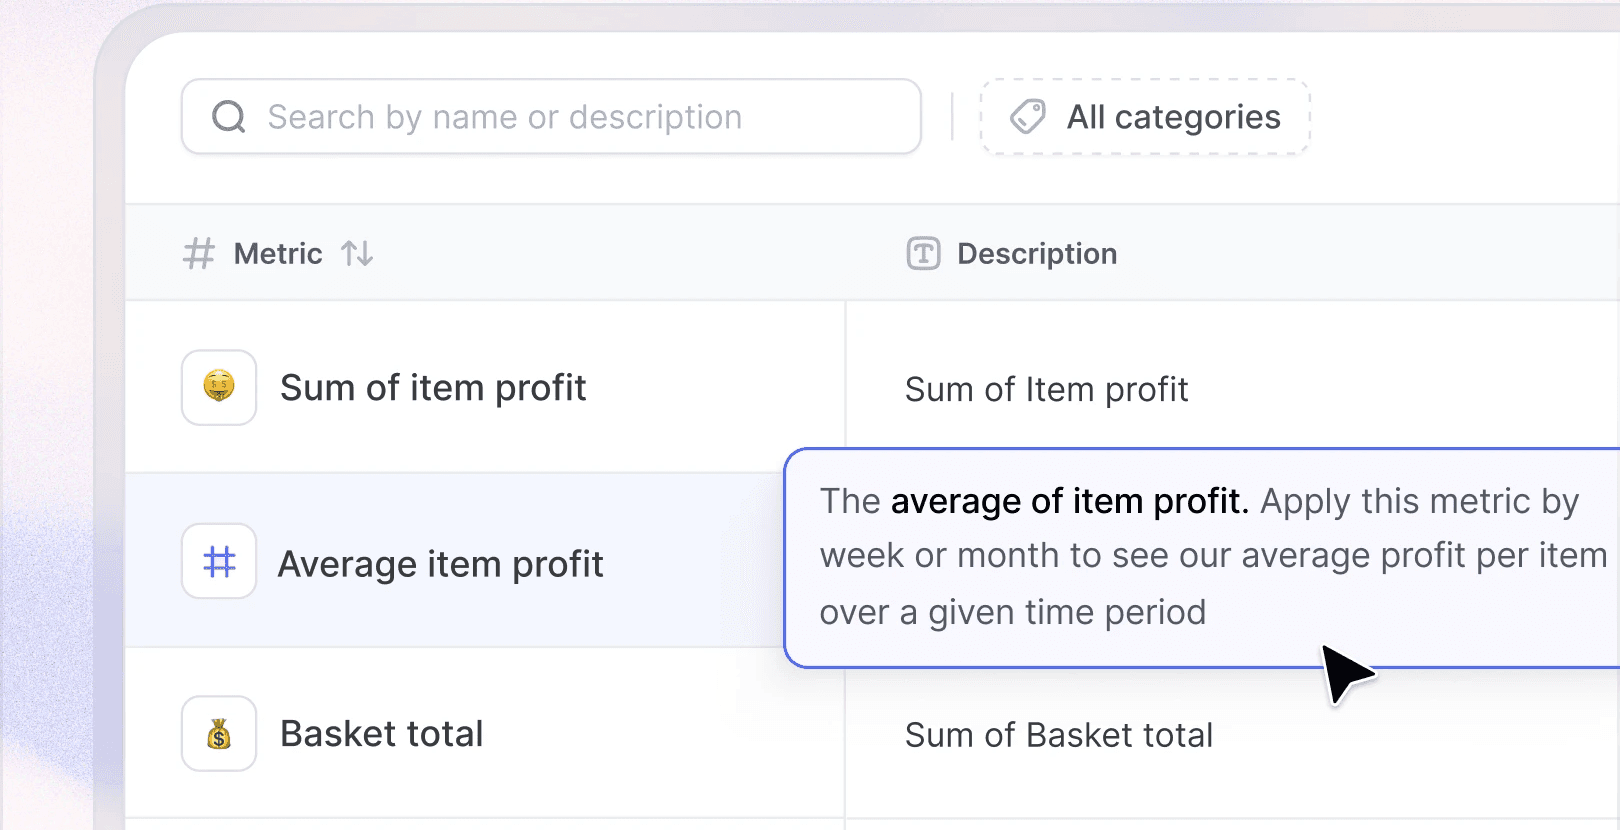
Search every metric in your semantic layer. Each metric shows its owner, its category and how often your team actually uses it.
Curate once, and your AI agents get better too
The categories, owners, descriptions and visibility rules you write for the catalog are the same context your agents and data apps read.
Agents retrieve the same metrics
A tighter catalog means answers that land on the approved definition.
Data apps inherit the definitions
Anything on the semantic layer uses your metric, not a fresh piece of SQL.
One definition, everywhere
Edit the metric in code and the catalog, charts, agents and apps all move together.
For any other questions, reach out to our team.
What is the Lightdash Metrics Catalog?
The Metrics Catalog is a searchable list of every metric defined in your Lightdash semantic layer. Each metric carries its definition, its owner, its categories, and how often it is used. From the catalog, anyone with access can open a metric in the Metrics Explorer and chart it over time without writing SQL.
What’s the difference between the Metrics Catalog, the Metrics Explorer and Metric Trees?
They are three views of the same metrics. The Catalog is the searchable list of approved metrics. The Metrics Explorer is what opens when you click one, charting it over time with filters, segments and comparisons. Metric Trees are shareable diagrams showing how metrics drive each other.
How do I control which metrics business users see?
You curate the catalog in YAML. Set spotlight.default_visibility to hide in lightdash.config.yml, then set visibility to show on the metrics you want surfaced. You can also assign categories, set an owner per metric, and restrict which dimensions people can filter and segment by.
Is catalog visibility the same as data access control?
No. Hiding a metric from the catalog is a curation setting for that view, not a permission. It keeps the catalog to a useful shortlist. Actual access is governed separately by Lightdash roles, spaces and user attributes, which the catalog always respects.
Do I need dbt to use the Metrics Catalog?
No. The catalog reads whatever metrics exist in your Lightdash semantic layer. dbt is the most common setup, and the spotlight config sits in your dbt YAML. You can also define metrics in standalone Lightdash YAML against your warehouse without dbt at all.
Does Lightdash charge per user for the Metrics Catalog?
No. Lightdash has flat rate pricing with unlimited users. A metrics catalog only works when everyone who asks a data question can reach it, so per-seat pricing would defeat the point. Check the pricing page for current plans.
How do Metric Trees work?
Declare drivers on a metric in your YAML and Lightdash draws the relationships for you, or connect metrics by hand on a canvas and save the tree to share it. Each node shows the metric with period-over-period comparison, so you can see which driver moved.
Does the Metrics Catalog work with Lightdash AI agents?
Yes, and they share the same curation. Categories, owners, descriptions and visibility all live in your context layer, so tightening the catalog also narrows and sharpens what AI agents and data apps retrieve. One pass of curation improves every surface at once.


