



Claude Dashboards let you turn questions about your data into dashboards using plain language. You can now ask Claude a question about your company's data and get a live dashboard back. I've spent most of today testing it out, and I’m really enjoying it.
Since this is a relatively new feature, here's a walkthrough of Claude Dashboards: what they are, how to build one, and how to connect the analytics tool you already use.
What are Claude Dashboards?
Claude Dashboards are interactive artifacts that turn a plain-language question into a set of live charts. You describe what you want to understand, Claude queries a data source you've connected, and the dashboard comes back with every chart traceable to the query behind it.
There are two things that make Dashboards different from artifacts today. First, you can click on any chart and see exactly where the number came from. And second, you can refresh the dashboard at any time, so it runs the queries again and keeps your data up to date instead of going stale the moment you close the chat.
How do Claude Dashboards work?
Building a Claude dashboard has two parts: gathering the data and creating the artifact.
First, you need to give Claude access to your data so it can answer your questions. You can do this via an Anthropic connector to your warehouse (BigQuery, Snowflake, Databricks, Redshift, ClickHouse) or with an MCP connector. In my testing, I connected Claude straight to Lightdash via the MCP, skipping BigQuery entirely.
Why connect your analytics tool rather than the warehouse directly? Because your metrics are already defined there. So, Claude doesn't have to work out what "revenue" means from raw tables in your warehouse; it looks up the definition your data team wrote and queries that. You also keep your existing permissions, so people only see what they're allowed to see.
How to build a Claude dashboard
Building a Claude dashboard takes four steps: connect a data source, ask for the dashboard, check where each number came from, and push the result to your analytics tool.
1. Connect your data
Pick a source Claude can reach. Use a built-in connector or add an MCP server by going to Settings → Connectors → Add custom connector. You just need to paste the URL and sign in.
2. Ask for a dashboard
The most important thing is to be specific about the question, the source, and the period. Here, I'm using a fictional company called Novidia that sells GPU chips, and my prompt was:
Make me a Claude dashboard using Novidia sales data from Lightdash.
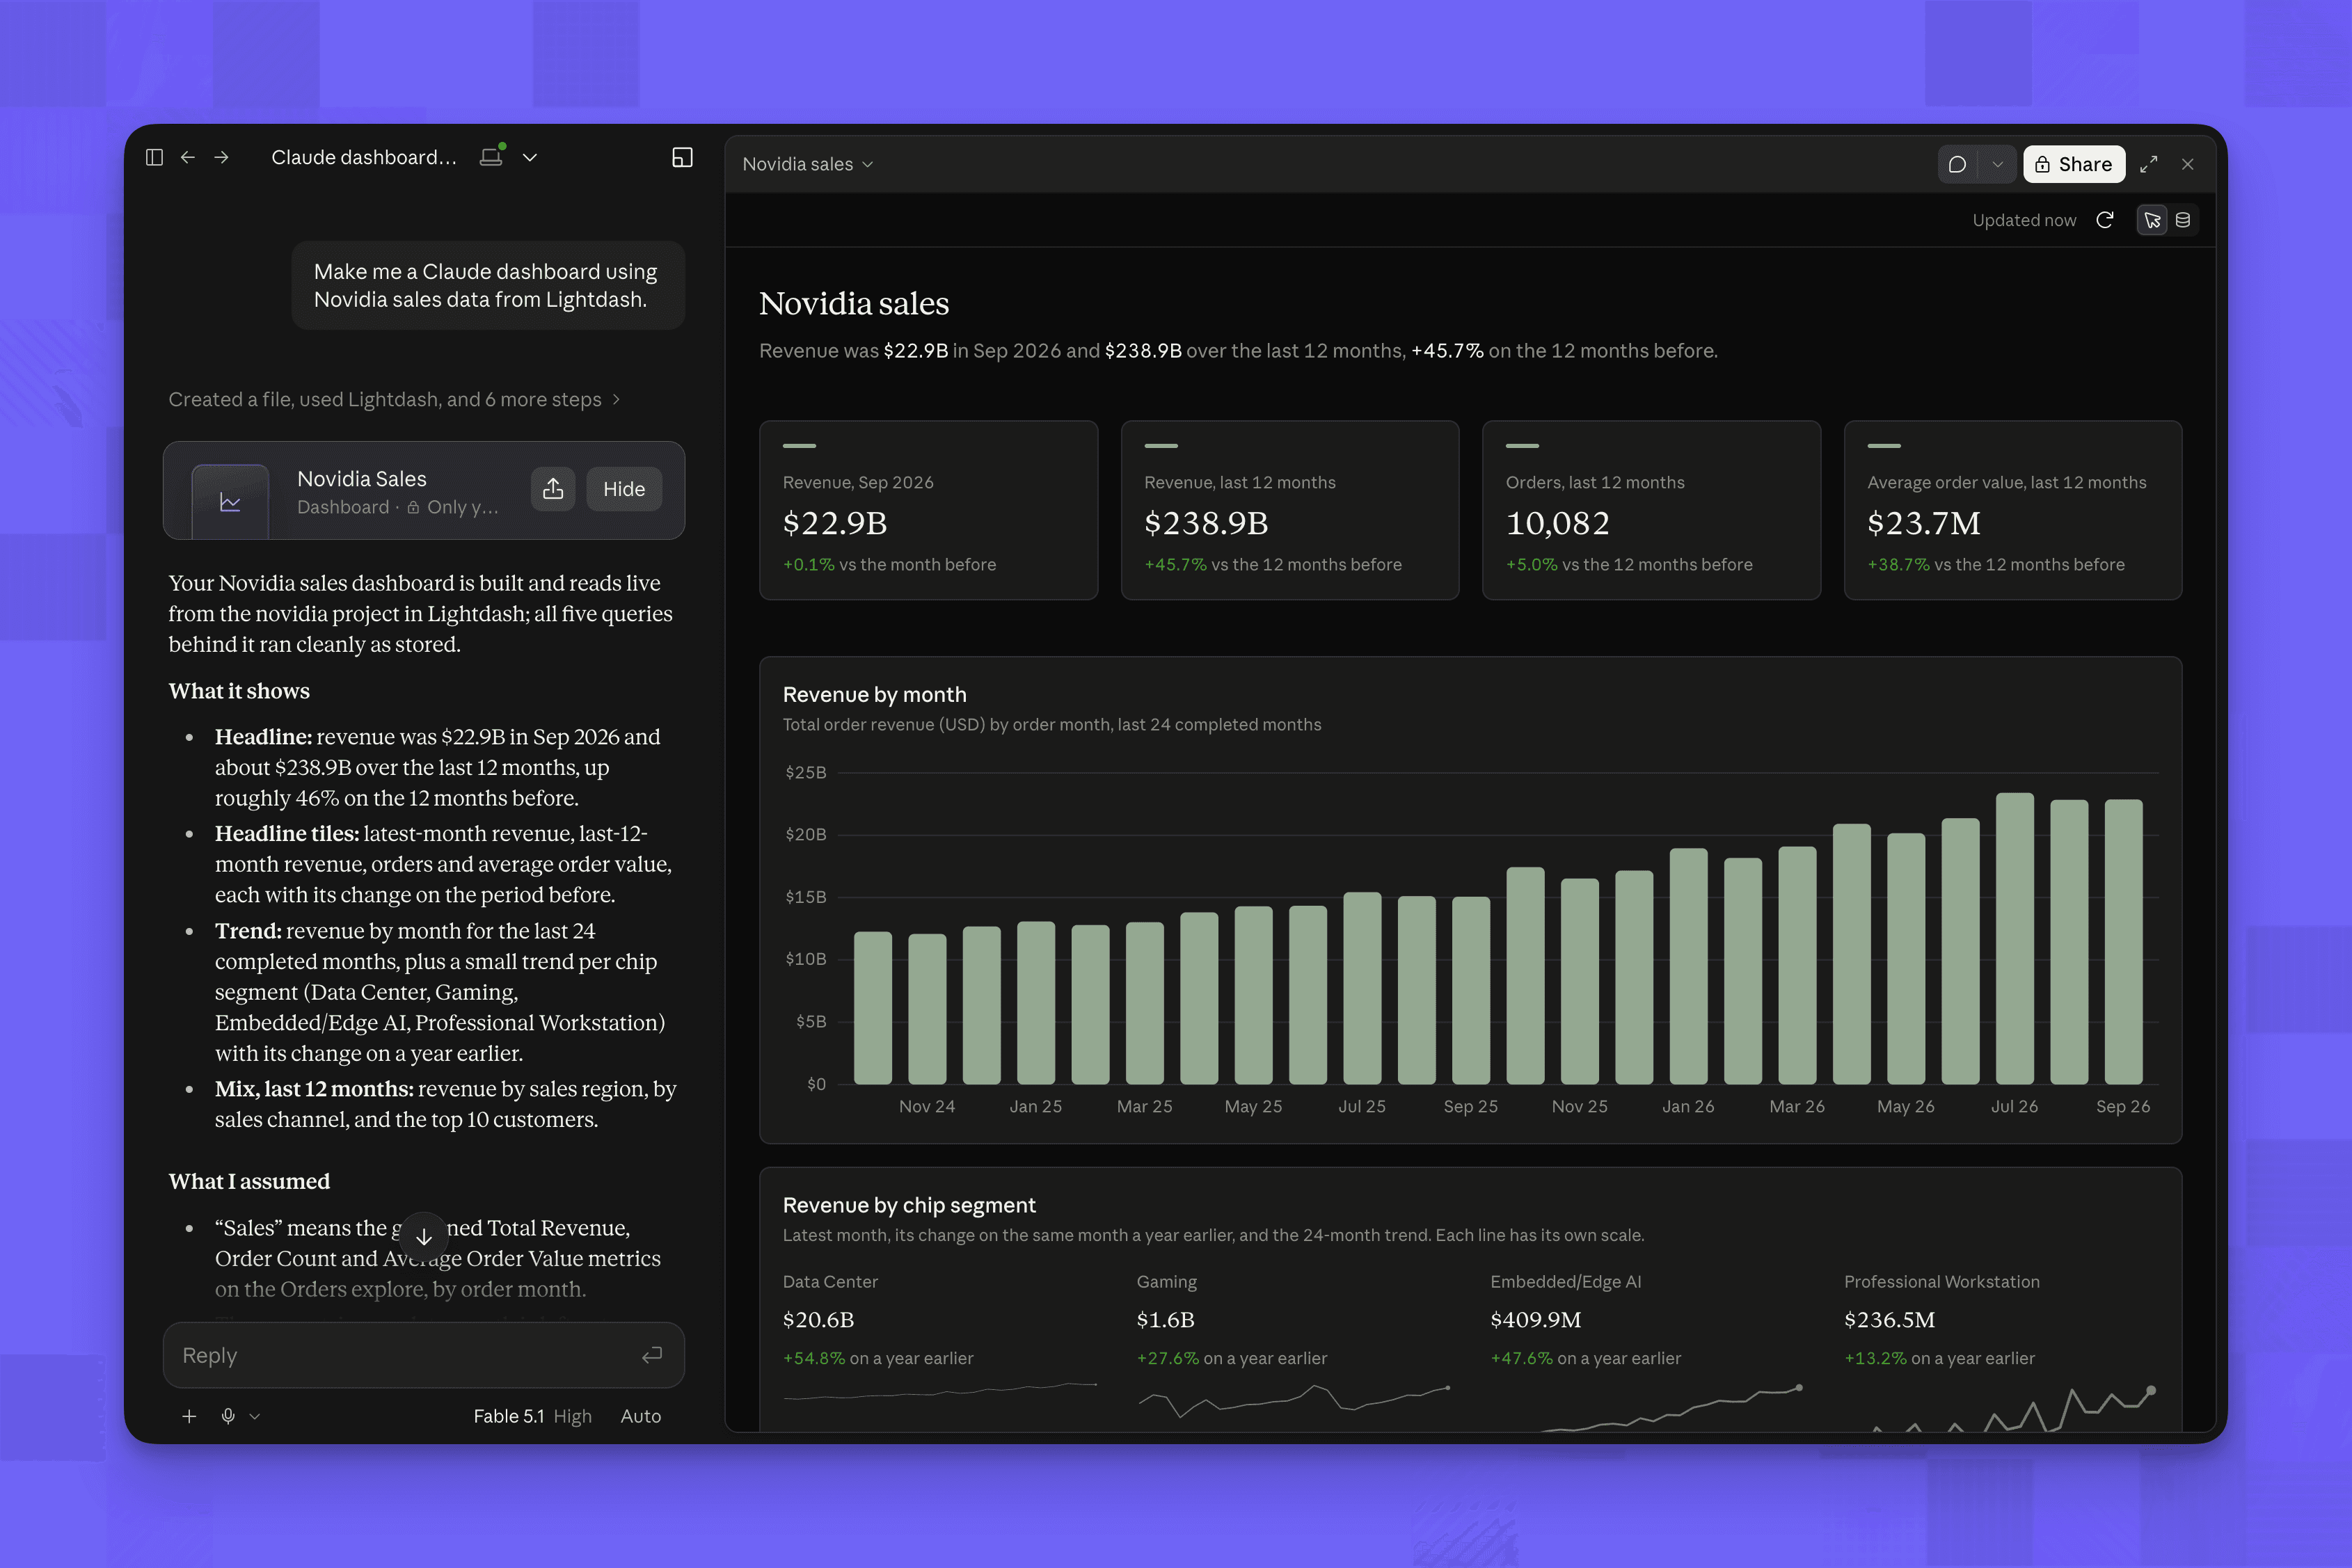
You can also start from the Artifacts tab and choose the Dashboards template. Either way, Claude searches the connected source to find the metrics it needs and asks your permission before it runs queries. Then it starts to build.
3. Check where every number came from
Once Claude builds the dashboard, you can click on any chart and a sidebar opens showing the call Claude made and what came back.

How much detail you get depends on the connector you’re using. With Lightdash I can see the project it used, the metrics it called, and the results the semantic layer returned, so every chart has full lineage. If I want to keep drilling in visually, I can click through and explore the same query in Lightdash.
4. Push it back to your analytics tool
Claude dashboards stay in the chat, but your team may need it somewhere they'll find it, with the right access controls. Once you’re happy with how your dashboard looks, you can push it back to your analytics tool.
To do that, I said:
Push this dashboard to Lightdash.
Claude then builds the charts and the dashboard in my Lightdash project and hands me a link. What it built in Lightdash was exactly what was in Claude.

Why use Claude Dashboards?
Claude Dashboards are great because they provide a quick way to start an analysis and develop it as new questions come up.
I found three capabilities that make them useful, especially for business users:
Build from a question. You can describe what you need to understand without specifying every chart in advance.
Inspect the supporting data. Users can check the requests and results behind a chart before relying on its numbers.
Refresh the results. You can run the dashboard’s queries again as the source data changes.
But it’s important to remember that the quality of the dashboard will still depend on the data and context available to Claude.
Where to start
Claude Dashboards is an easy way to go from a question to a live set of charts. If your team already has its metrics defined in an analytics tool, connect that first so Claude can build on the definitions you've already agreed on and the permissions you've already set.
If you want to try it out, here are a few prompts to start with:
"Build a dashboard of monthly revenue by product for the last 12 months."
"Show me which customers are at risk of churning based on product usage."
"Push this dashboard to my analytics tool and put it in the Sales space."
And if you're on Lightdash, connect the MCP and try it today.
Ready to free up your data team?
Try out our all in one open, developer-loved platform.