
Data teams are still hand-building dashboards that an agent could build in less than 2 minutes.
They’re doing it because someone in marketing needs a campaign report. Or finance changed the revenue definition and now eight dashboards need rebuilding. Or a new client needs the same views as the last twelve, just with different filters.
And they'll do it again next week. And the week after that.
This is the invisible tax of traditional business intelligence: human time spent on machine work.
Most AI BI tools try to make this work faster. Better SQL autocomplete. Smarter chart suggestions. A chatbot that can write queries for you.
All helpful, but here's the question that actually matters: why are humans doing this work at all?
What our CTO built in 10 minutes (without writing code)
A few days ago, our CTO, Oliver, wanted to measure engineering velocity for the Lightdash team. He had GitHub data sitting in BigQuery, but no dbt models, no metrics, nothing.
He opened Claude Code and gave it a single instruction:
"I want to measure the engineering velocity and performance of our team at Lightdash. Develop the Lightdash models and metrics needed to do that."
Then he made coffee.
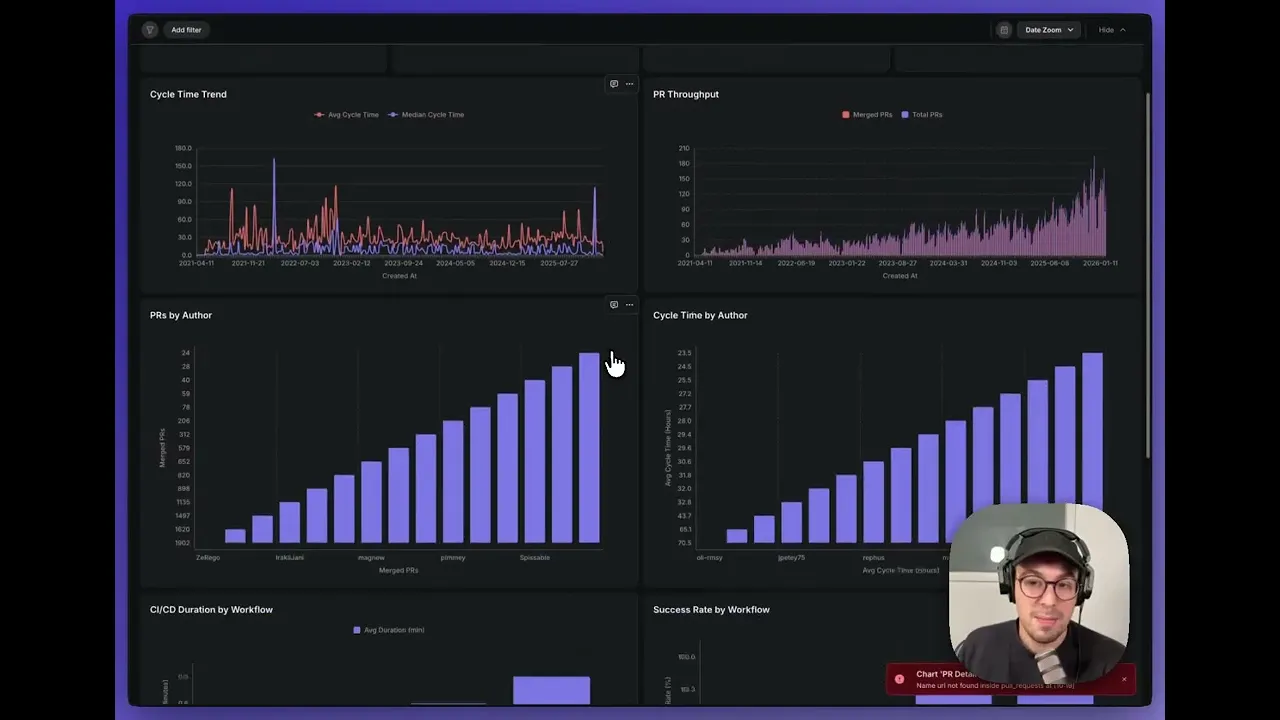
10 minutes later, he had:
A complete semantic layer with metrics and dimensions
Charts showing velocity trends
A dashboard with everything assembled and deployed
Now here's what Oliver didn't do:
Write SQL
Define metrics manually in YAML
Build charts one by one
Configure dashboard layouts
What he did do:
Set the goal
Answered two clarifying questions from the agent
Reviewed the output
Made notes on style tweaks he'd want
He went from zero to an 80% solution without writing any code.
That is Agentic BI. A way for data teams to delegate entire workflows so they can spend their time on strategic work instead.
The evolution of AI in business intelligence
Most BI tools are stuck debating Era 1 vs Era 2. Let me show you why Era 3, Agentic BI, is fundamentally different.
Era 1: Traditional BI tools
These are the tools we think of when we hear BI. Drag-and-drop UIs, SQL editors, hand-built dashboards, and data teams constantly backlogged with endless requests.
The limitation here was simple: BI scaled linearly with headcount. Getting more dashboards meant hiring more people.
Era 2: AI-assisted BI
This is where most BI tools are today. Chatbots that write SQL, with "Ask a question, get a chart" interfaces.
This makes data teams faster at work they're already doing. They're still doing repetitive work - just more efficiently.
If you're prompting for every chart, you're using a chatbot. Not an agent.
Era 3: Agentic BI
This is different, and it’s where we should all be headed.
In Agentic BI, agents handle the repetitive parts of BI:
Building and maintaining dashboards
Monitoring metrics continuously
Fixing things when they break
Generating summaries proactively
Replicating work across contexts
Data teams focus on what requires judgment:
Setting goals and context
Reviewing and approving
Making strategic decisions
Governing quality
The fundamental shift is that teams move from executing to directing.
How to identify Agentic BI vs AI-assisted BI
Most tools calling themselves "AI BI" or "agentic analytics" are chatbots with access to your data. Here's how to tell the difference:
1. Can it build complete systems, not just individual artifacts?
True Agentic BI builds entire dashboards and the semantic layer underneath them. Not just one chart at a time.
2. Does it maintain what it builds?
If a metric definition changes, does it update downstream dashboards automatically? If something breaks, does it fix itself? This is autonomous analytics in action.
3. Does it work proactively, not reactively?
Does it monitor and alert without being asked? Does it identify anomalies before you notice them?
4. Does it have memory and context?
Does it know what "revenue" means in your business? Can it learn from feedback? This is what separates agentic systems from AI chatbots.
5. Does it integrate with your existing data workflow?
Does it work inside version control? Does it respect governance rules? Can it deploy through CI/CD?
If you answered "no" to any of these, you're not using Agentic BI. You're using a very good AI-powered chatbot.
Agentic BI in practice: 7 chart updates in 3 minutes
Let me show you another example of Agentic BI in action.
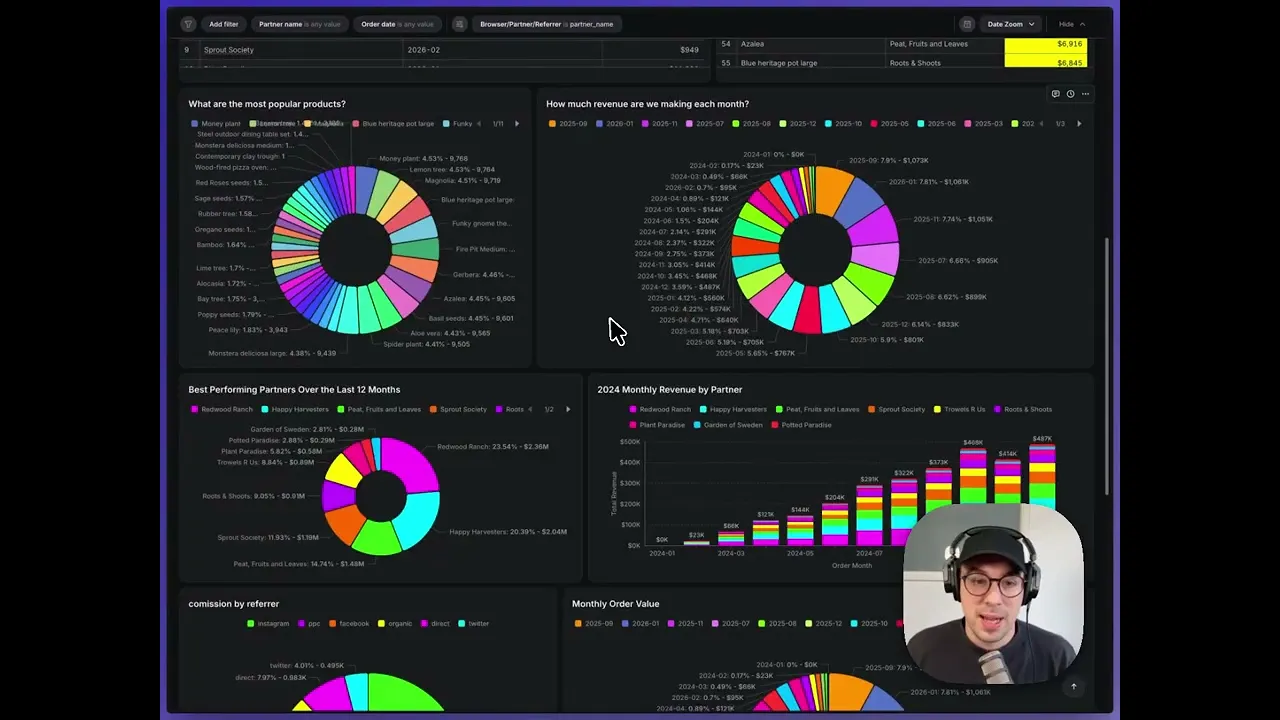
Oliver had a dashboard he wasn't happy with. There were too many neon colors, and donut charts everywhere that should be bar charts.
Normally, this would mean 30 minutes of clicking through the UI, opening each chart, updating colors one by one, switching chart types, checking layouts.
Instead, he told Claude Code:
"For the sales updates dashboard, the neon colors are too much. Make them much more gentle and remove all the pie charts and replace them with bar charts.”
The agent then:
Read the YAML files describing all seven charts
Updated color palettes consistently
Converted pie charts to bar charts with proper configurations
Ran validation checks
Deployed changes to production
It took three minutes, and then Oliver went back to his coffee.
What does Agentic BI mean for data teams?
When business intelligence becomes agentic, data teams stop spending time on:
Building dashboards from scratch repeatedly
Responding to one-off report requests
Updating metrics across multiple dashboards
Translating the same business logic into SQL over and over
Explaining what metrics mean for the 50th time
Instead, they become system designers, context setters, quality governors, and strategic advisors.
The productivity gain from agentic analytics isn't that you’re building dashboards faster; it’s that you stop building most of them at all.
The future of Agentic BI
The future of business intelligence is freeing data teams from repetitive work. At Lightdash, we’ve stopped asking "How can AI help me build this faster?" and started asking "Should I be building this at all?"
The teams that adopt Agentic BI first will spend their time on strategically valuable work and the most time-consuming analysis that requires deep human time. Most of the day-to-day reporting requirements shouldn’t even be on their plate.
Want to see what Agentic BI looks like for your team? We've been building toward this for a while - dbt-native semantic layer, version control, real governance - all the infrastructure needed for agents to actually work in production.
Or if you're technical and want to try it yourself, here's the setup guide for getting Claude Code working with Lightdash.
Ready to free up your data team?
Try out our all in one open, developer-loved platform.


