Your entire BI as code

Your metrics, charts, and dashboards live as code. Build them with coding agents, review them in pull requests, and update 50 charts in one command. All on your governed context layer.

The best data teams are shipping analytics as software

Coding agents don't have to click through a dashboard builder.

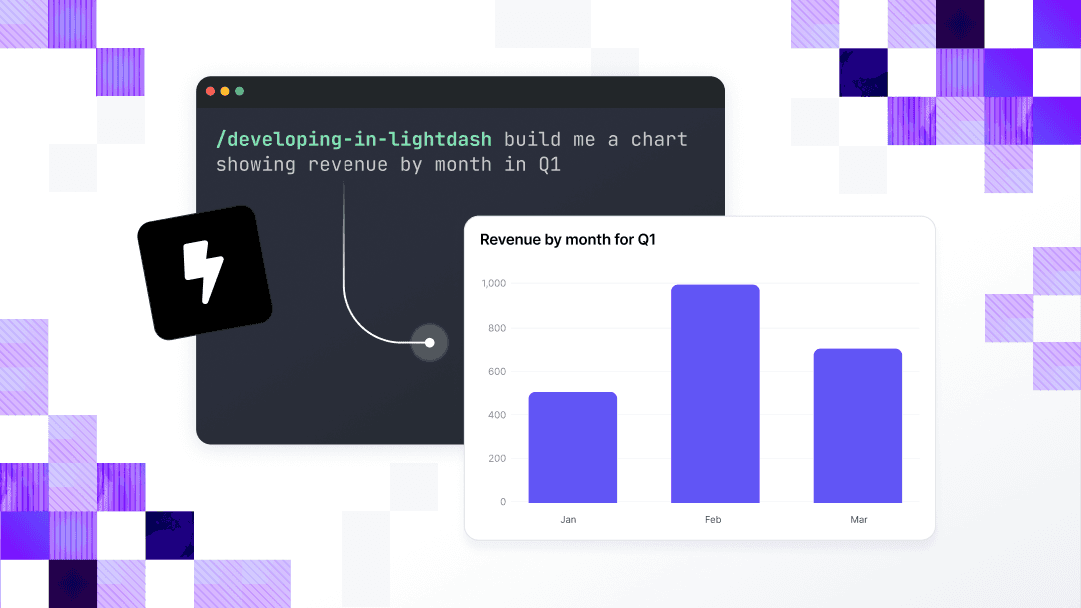
Describe the dashboard. Your agent writes it.

Use Lightdash skills to teach your coding agents how the platform works, and start building dashboards from prompts.

Review analytics like you review software.

Every chart and dashboard is a file, so changes move through the workflow your team already trusts: open a PR, spin up a preview environment straight from the CLI, get a review, merge.

Run maintenance in one command.

Make maintenance work scriptable: validate your whole project in CI, fix what breaks in bulk, and migrate off your current tool with a script instead of a quarter of rebuilds.

Coding agents don't have to click through a dashboard builder.

Describe the dashboard. Your agent writes it.

Use Lightdash skills to teach your coding agents how the platform works, and start building dashboards from prompts.

Review analytics like you review software.

Every chart and dashboard is a file, so changes move through the workflow your team already trusts: open a PR, spin up a preview environment straight from the CLI, get a review, merge.

Run maintenance in one command.

Make maintenance work scriptable: validate your whole project in CI, fix what breaks in bulk, and migrate off your current tool with a script instead of a quarter of rebuilds.

What makes BI-as-code work

Lightdash CLI

Deploy, preview, validate, and rename from your terminal or CI.

MCP server

Connect Claude, Cursor, or your internal agents to Lightdash.

Agent skills

One command teaches your coding agent Lightdash conventions.

Git integrations

GitHub, GitLab, Azure DevOps, and Bitbucket, with PR previews.

What makes BI-as-code work

Lightdash CLI

Deploy, preview, validate, and rename from your terminal or CI.

MCP server

Connect Claude, Cursor, or your internal agents to Lightdash.

Agent skills

One command teaches your coding agent Lightdash conventions.

Git integrations

GitHub, GitLab, Azure DevOps, and Bitbucket, with PR previews.

What makes BI-as-code work

Lightdash CLI

Deploy, preview, validate, and rename from your terminal or CI.

MCP server

Connect Claude, Cursor, or your internal agents to Lightdash.

Agent skills

One command teaches your coding agent Lightdash conventions.

Git integrations

GitHub, GitLab, Azure DevOps, and Bitbucket, with PR previews.

Kevin Otte

fal.ai

Data Scientist

"The shift to dashboards-as-code and agent-driven workflows has been huge for us. We can update, version, and replicate analytics the same way we ship software without spending hours clicking around the UI."

Kevin Otte

fal.ai

Data Scientist

"The shift to dashboards-as-code and agent-driven workflows has been huge for us. We can update, version, and replicate analytics the same way we ship software without spending hours clicking around the UI."

Kevin Otte

fal.ai

Data Scientist

"The shift to dashboards-as-code and agent-driven workflows has been huge for us. We can update, version, and replicate analytics the same way we ship software without spending hours clicking around the UI."

90%

of agent-generated code approved

30

minutes to go from data model to dashboard

85%

of data requests answered in 24 hours

Your questions, answered

Your questions, answered

For any other questions, feel welcome to reach out to our team.

What is BI as code?

BI as code means your analytics layer is defined in version-controlled files instead of locked inside a UI. In Lightdash, metrics, charts, and dashboards are YAML in Git, so you can build them with AI coding agents like Claude Code or Cursor, review changes in pull requests, and roll back mistakes.

Do I need dbt to use BI as code in Lightdash?

No. Lightdash builds its semantic layer from your dbt project or from standalone Lightdash YAML files pointed at your warehouse, with the same syntax. If you adopt dbt later, migration is straightforward. Either way, your metrics are defined once, in code, and every chart is built on them.

Do business users have to write code?

No. Business users explore data, filter dashboards, and ask questions through the UI and AI agents, same as any analytics tool. BI as code is for your data team and your coding agents: they build and maintain content in Git while everyone else consumes it without knowing the YAML exists.

How do Claude Code and Cursor build correct dashboards?

Run lightdash install-skills and your coding agent learns Lightdash conventions: how to write valid chart and dashboard YAML on your defined metrics. The Lightdash MCP server does the same for Claude and your internal agents. Because agents build on the semantic layer, they use governed definitions instead of guessing at SQL.

Will AI edits break my production dashboards?

Changes go through the same controls as your software. Spin up a preview environment from the CLI, run lightdash validate in CI to catch charts a dbt change would break, and review every edit as a pull request before it merges. Nothing lands in production without a human approving it.

Do we have to use AI?

No. Lightdash supports traditional exploration and dashboards alongside AI. Teams can adopt BI-as-code gradually.

I have an infrequently asked question.

Great! We're always around to help. You can chat to us through the live chat on this webpage, or talk to us in our Slack community.

Join our newsletter to be en-lightened

© 2026 Telescope Technology Limited. All rights reserved.

Join our newsletter to be en-lightened

© 2026 Telescope Technology Limited. All rights reserved.

Join our newsletter to be en-lightened

© 2026 Telescope Technology Limited. All rights reserved.