
A couple of years ago, we made a bet on something we've believed in for a long time: that analytics has to work like software.
Version-controlled, programmable, and built for the tools developers actually live in.
We built the Lightdash CLI on that belief. The idea was simple: if your data team works in code, your BI layer should too. Dashboards shouldn't live inside a UI that no one can automate. Metrics should be deployable, changes should be reviewable, and analytics should ship the same way software does.
That conviction led us to build something that goes well beyond generating SQL or answering questions in a chat window. The Lightdash CLI gives AI agents write access to your analytics layer. It lets you preview, validate, and deploy changes through Git - the same discipline software engineering has had for decades, finally applied to BI.
And now, with AI agents becoming a real part of how data teams work, we're seeing what that foundation actually unlocks.
Here’s how three teams are using the Lightdash CLI to ship analytics with AI and what each one proves about what's possible when your BI layer is truly programmable.
Three patterns we're seeing across data teams
Most data teams have already adopted AI in some form. But it tends to look the same: an AI tool writes some SQL, drafts a model, speeds up a query. Useful but not transformative.
The real gap is using AI to build, update, and operate your analytics end to end. For that to work, your AI needs more than a chat window. It needs a programmable interface with write access to your analytics layer.
Data teams using the Lightdash CLI are working in a fundamentally different way. Across the teams we spoke to, three patterns kept emerging:
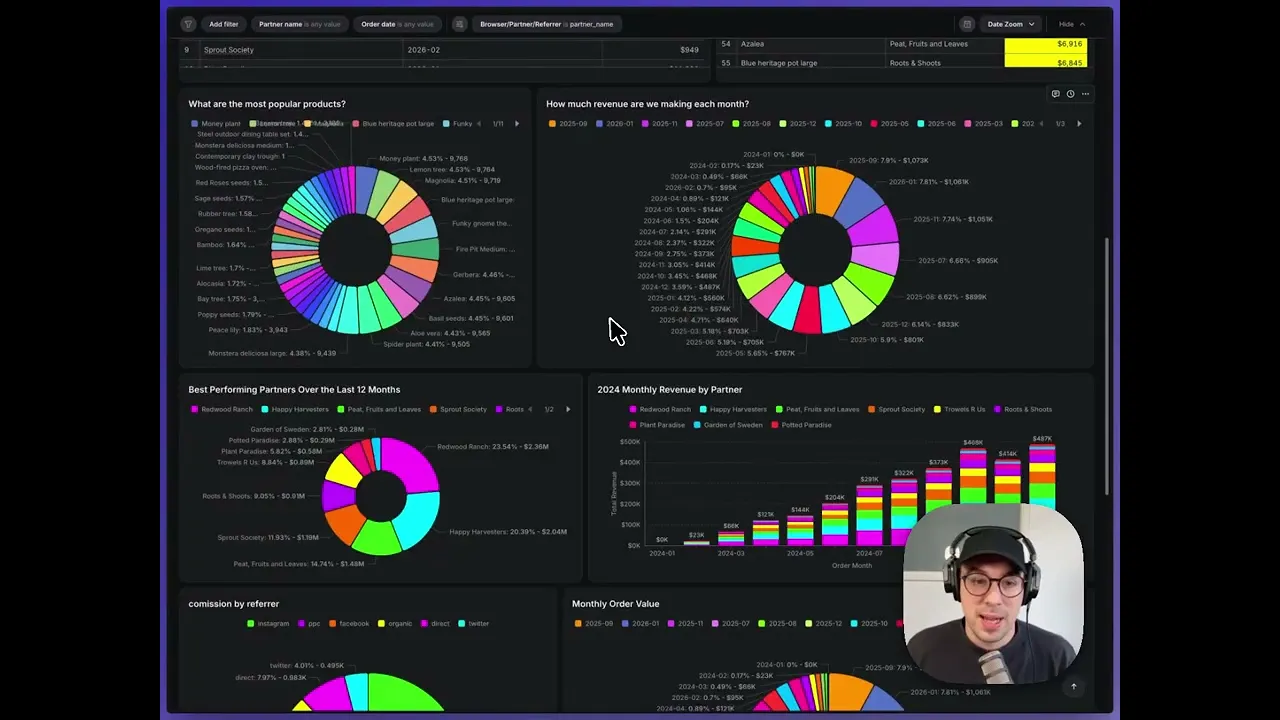
BI layers transforming from passive dashboards into living systems for data teams
Smaller data functions supporting entire companies without burning out
Business users turning questions into production metrics
Here's what each one looks like up close.
JustWatch built a system teams actually use to build, test, and ship
JustWatch needed metrics to stay consistent as they scaled access across 150+ employees. Their requirements were clear:
dbt as the source of truth
version control
CI/CD
And the ability to iterate quickly without every change becoming a manual deployment exercise.
They put the Lightdash CLI at the centre of their deployment workflow:
Preview before it ships.
With lightdash preview , the team spins up a preview environment, and gets stakeholder sign-off before anything touches production.
Validate before it merges
lightdash validate catches broken charts and missing metrics before users ever see them. The same quality gates that protect their software, now protecting their analytics.
Deploy from the terminal
lightdash deploy pushes new metrics and models to Lightdash instantly, so the team doesn’t have to leave the tools they already work in.
With this new workflow, analytics became something teams could build, test, and ship - not just consume.
One data person at fal manages data requests from 80 stakeholders
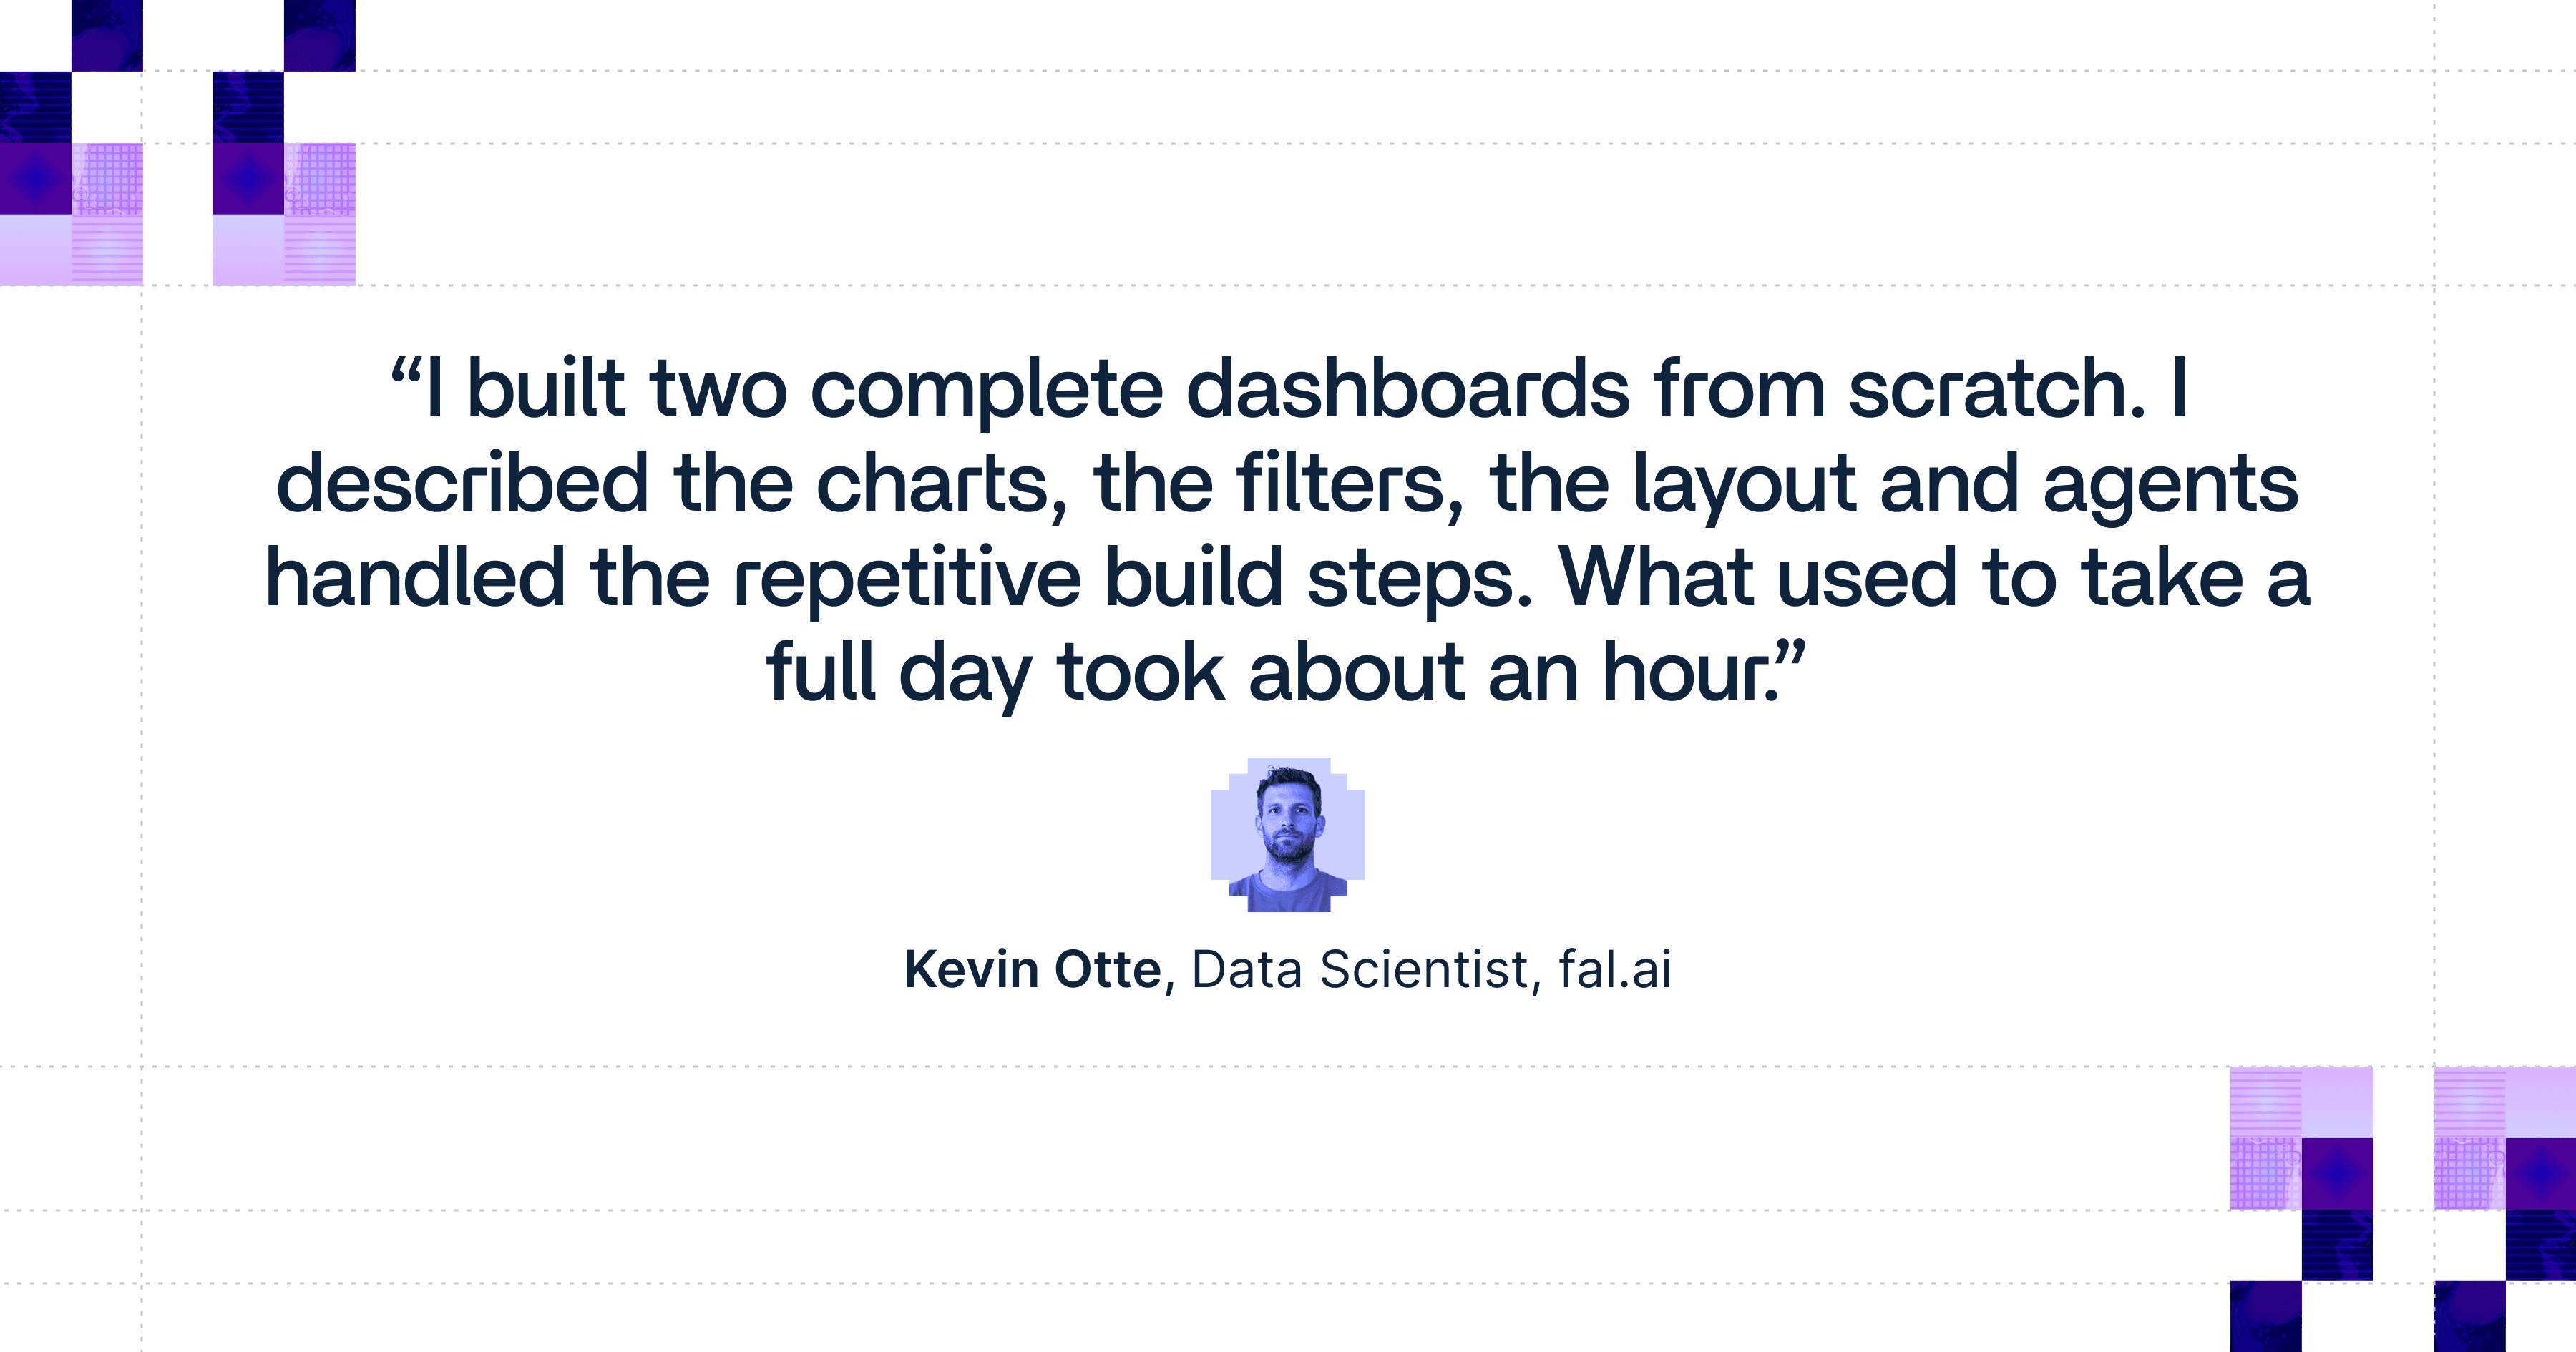
fal’s only Data Scientist, Kevin, set up Lightdash's Agentic BI workflow with the CLI at its core. Now, a ticket comes in through Linear or Slack, a Cursor agent picks it up, accesses the Lightdash MCP server, reads the semantic layer, builds the chart or dashboard, and creates a preview link for Kevin to review before anything goes to production.
Kevin can be in a strategy meeting, building out the next part of the data model, or simply not at his desk while dashboards are being built in the background.
Instead of Kevin answering every data question, the system answers for him. The numbers back it up:
90% of agent-generated code gets approved
85% of data requests answered within 24 hours
Dashboards that used to take a full day now take 30 minutes.
Generation Home went from a question to a production metric in two days
When Gen H's Chief Commercial Officer, Hal, needed to understand the relationship between mortgage complexity and conversion rates, he didn't raise a ticket. He opened Claude Code and the Lightdash CLI.
Hal explored the underlying data himself, iterated on the logic for a complexity score metric, and wrote it back into the Lightdash semantic layer without needing a data team to translate his question into SQL. The CLI gave him the write access and the iteration loop. The semantic layer meant his work landed somewhere governed, consistent, and reusable by anyone in the business.
Two days later, a production metric was live. What started as a question became a permanent part of how the business measures itself.
That's the difference between a BI tool and a programmable analytics layer. One answers questions. The other lets anyone with the right access build the answers into the system.
What the CLI actually unlocks
These three use cases point to a new model for how analytics works and what becomes possible when your BI layer is truly programmable.
Here's what sits underneath each of these stories:
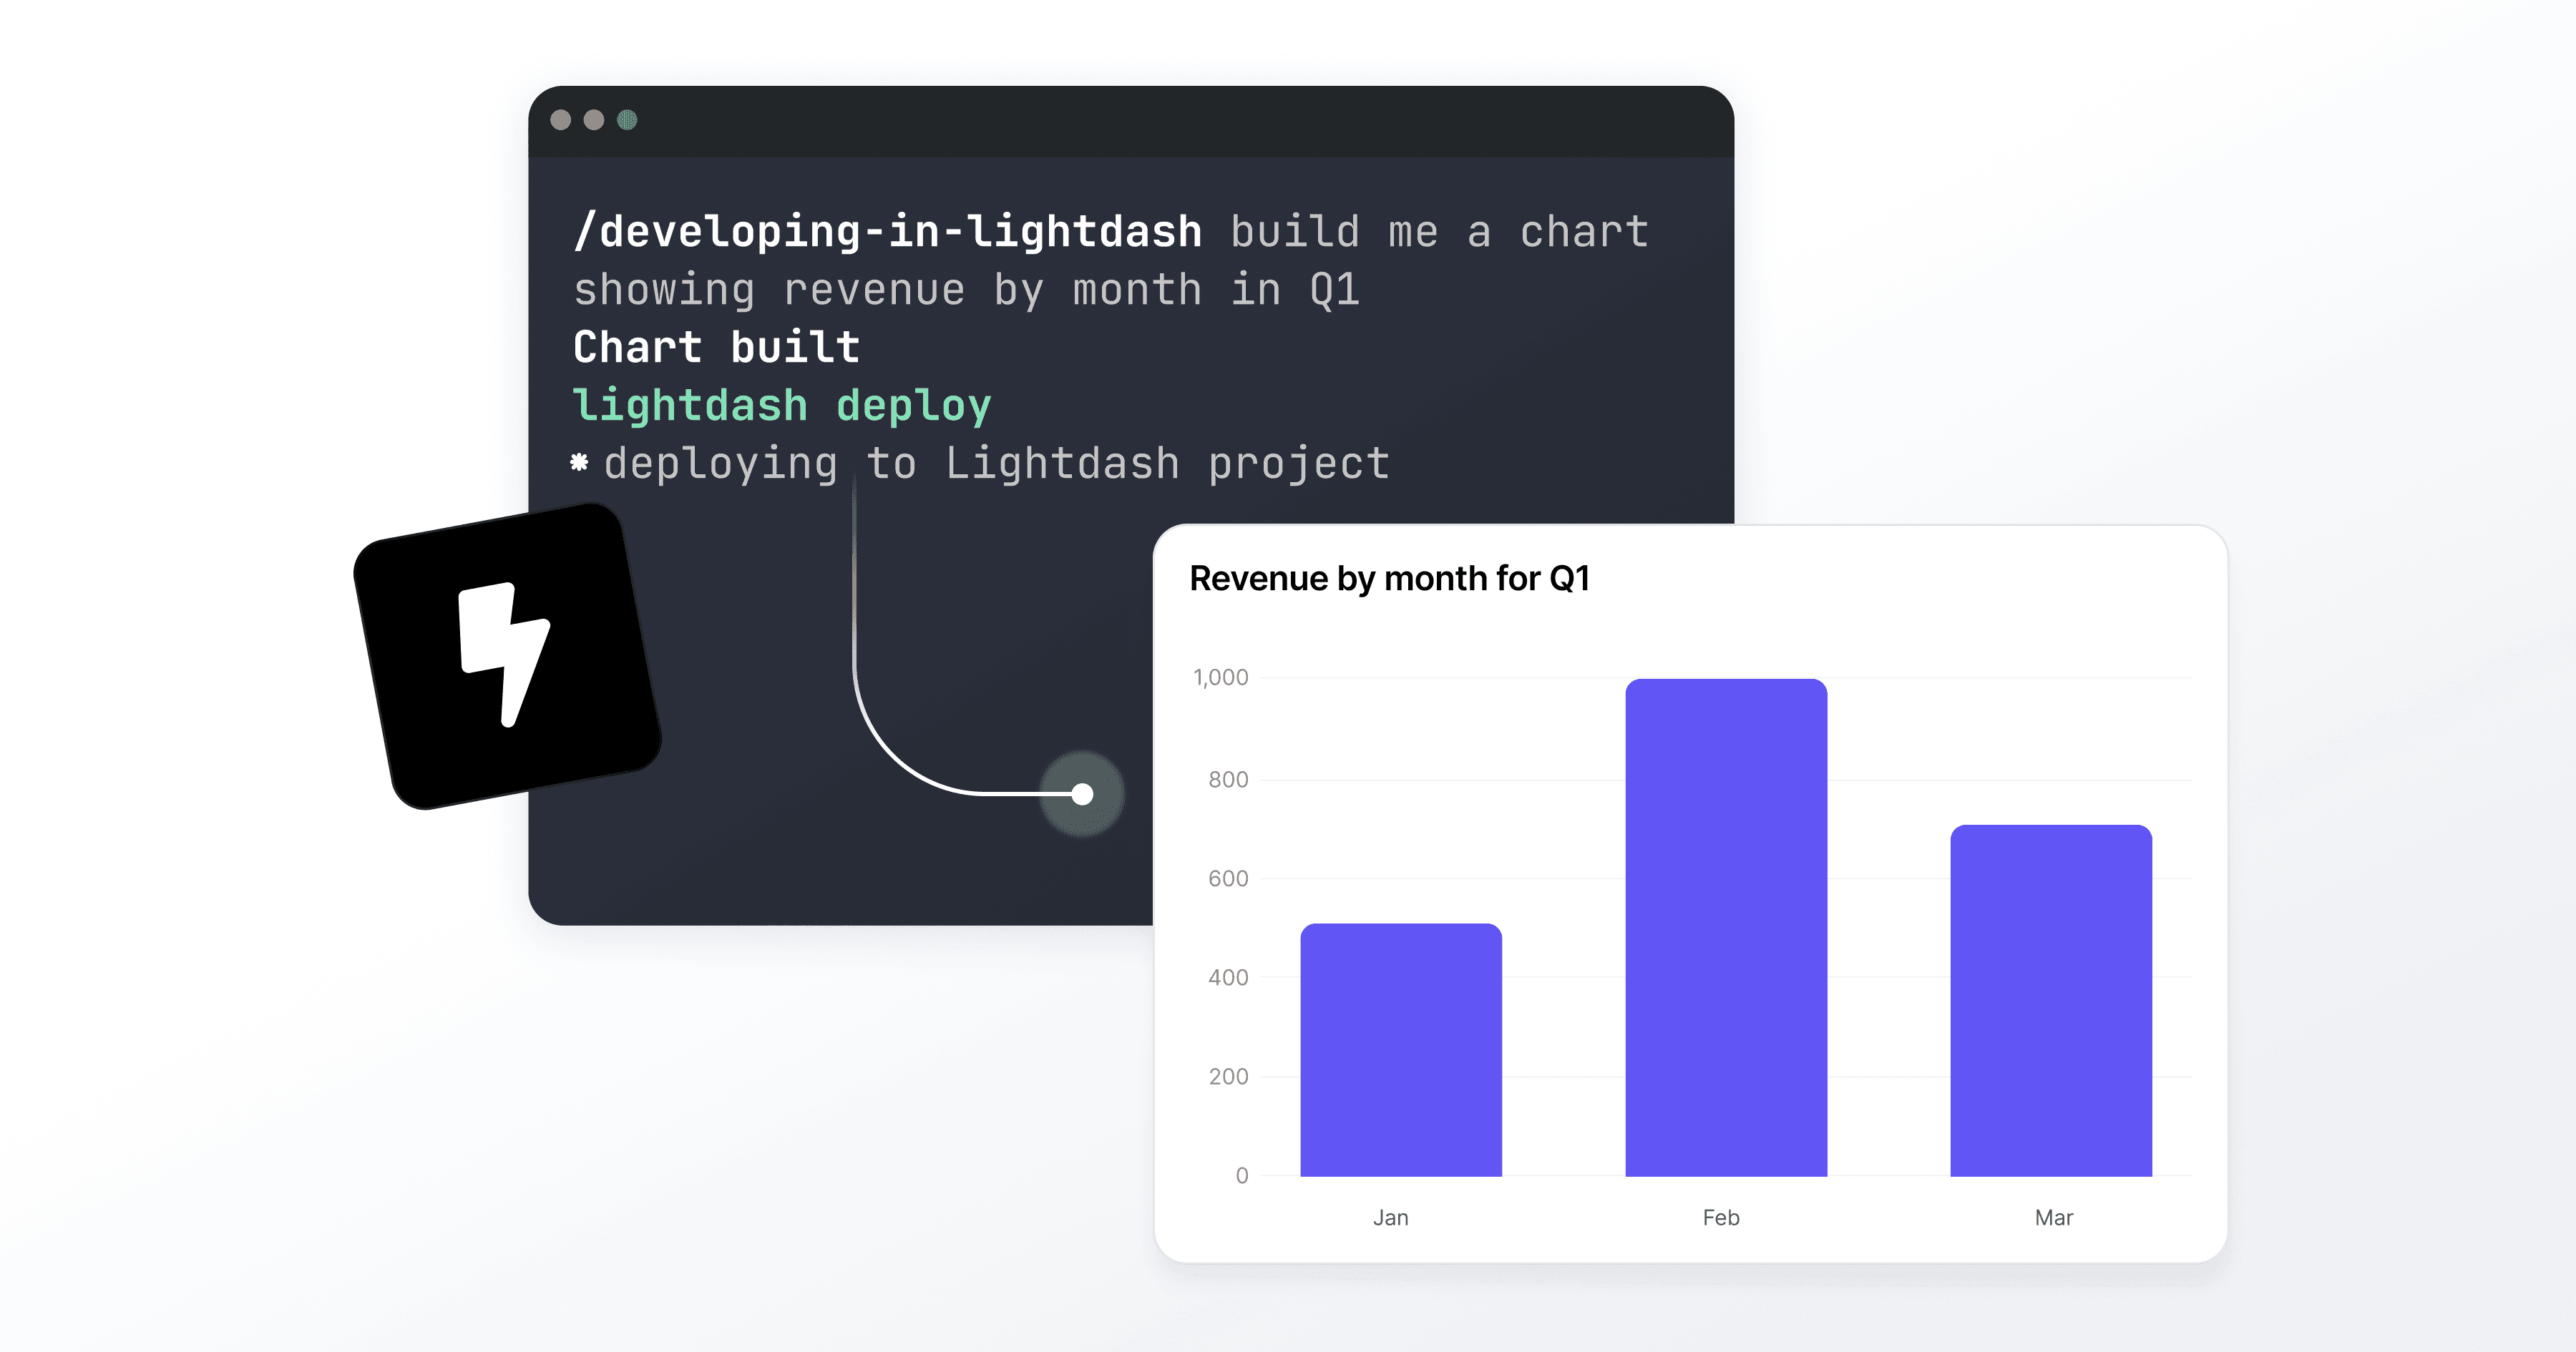
Agents that write, not just read. The CLI gives AI agents write access to your analytics layer. Instead of using AI to answer questions, you can use it to build the answers into the system, where anyone can use them. Here's a quick walkthrough showing how:
Analytics as code. Preview, validate, and deploy changes through Git-based workflows. The same discipline software engineering has had for decades, now applied to BI.
Reusable systems, not one-off answers. Work built through the CLI lands in the semantic layer: governed, consistent, and available to everyone.
Faster iteration, tighter loops. Data teams can move at speed without sacrificing governance.
If your AI can only answer questions, it's a faster search bar - not agentic analytics.
What this means for your data team
The teams above aren't outliers. They're early, but this pattern is one we're seeing everywhere.
Data teams that treat their BI layer as code (deployable, reviewable, agent-operable) are moving faster, scaling further, and spending more time on the work that actually requires human judgment.
The Lightdash CLI is how we make that possible. It's not a feature we added to keep up. It's the foundation we built when we decided that BI should work like software, and we've been building on it ever since.
If you want to see what BI looks like when it's designed for agents from the ground up, your terminal is the right place to start.
See it in action
Whether you want to watch it work or talk through what it could look like for your team - we're here.
Book a demo or watch it work →
Ready to free up your data team?
Try out our all in one open, developer-loved platform.


